Data nerds rejoice! We have released our reporting feature! Track your animal shelter or animal rescue’s data on beautiful, easy to read reports.
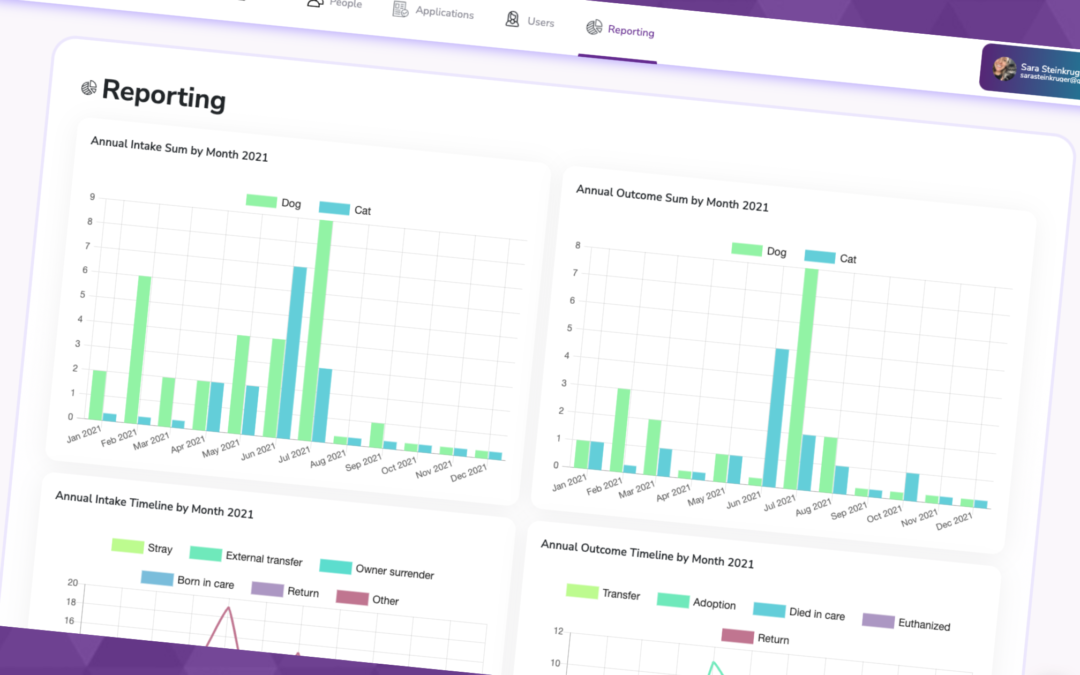
To see your organization’s reports, simply head on over to the new ‘Reporting’ tab at the top of your screen when you log in. From there we will automatically run reports on your animal’s income and outcome data. Scroll through the reporting page to see reports from each year you have data stored in Pawlytics.

Click into each graph for more PUP-tastic features!
Hover over the data points on your graphs, you will be able to see the number and types of intakes and outcomes. Use these graphs to see your monthly numbers for all intakes and outcomes.

View a list of all pets included in the report. The list of pets will allow you to easily compare the pets in your database and seamlessly keep track of their data.

Simply, click on the type of income or outcome to exclude data in the graph. Only want to see your adoption numbers? Easy! Click on every other type of outcome at the top of the graph to view only your adoptions.
![]()
Click on them again to bring the data right back into view. Need to compare your adoptions and transfers? Just re-click on that type of outcome and you’ll be on your way to finding trends in your data to help you save more lives!

Keep track of your busiest months from year to year. Know when you are having spikes in adoptions, or when to buckle down on lowering euthanasia rates. These graphs are here to help YOU understand the AMAZING work your rescue or shelter is doing.
If you are interested in how Pawlytics can help you track your rescue or shelter’s data, check out our free trial here! We’d love to meet you and hear about your work too, you can always book a meeting with us anytime!
Utilizing DATA to SAVE LIVES!